-
Getting Started
-
Device Management
-
Automations
-
Dashboard
-
User Management
-
LoraWAN
-
API and Integrations
-
Boards
-
DIY
-
Gateway
Icons and Details
IoT Stadium provides a seamless experience for managing connected devices through its Devices menu. Other than adding more device, you can also:
1. View Device Data: Access real-time telemetry data from all connected devices, empowering you with up-to-date insights into device performance and status.
2. Remote Device Control: Remotely control devices directly from the platform, ensuring efficient management and immediate response to changing requirements.
3. Custom Widgets for Dashboard: You can personalize your Dashboard by configuring widgets directly from the Devices menu. This feature allows for a tailored and intuitive monitoring experience.
4. Automated Reporting System: You can a timely report about your device’s data. You have the flexibility to assign one or multiple users who will receive these comprehensive reports via email.
5. Set A User Access: Customize access levels by assigning the User role to individuals, limiting their permissions for specific devices.
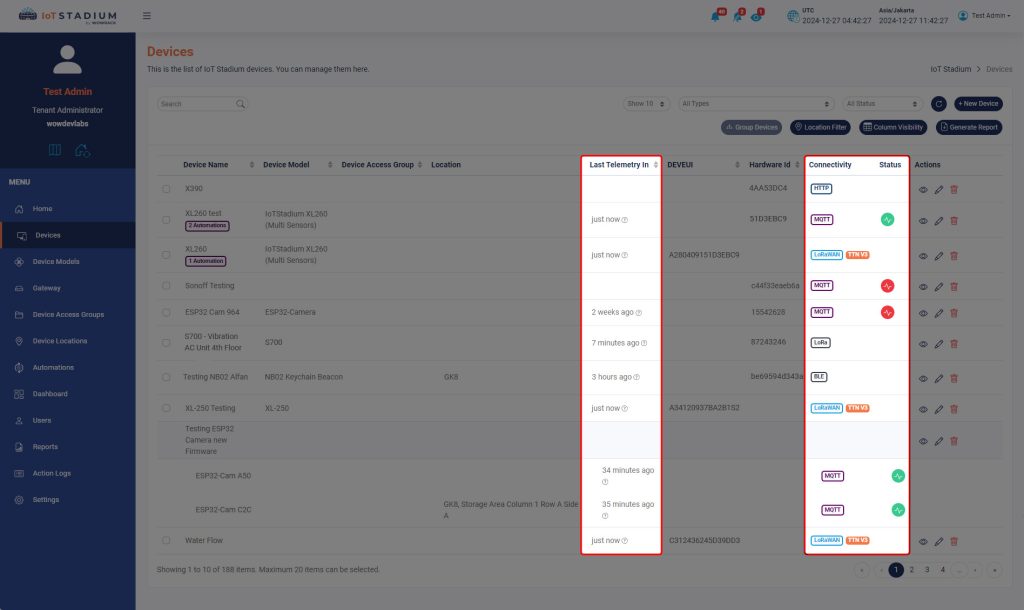
You can also set the display detail on the Devices menu, where there are several columns and icons providing an information about the devices.
The default display of Devices menu will be like this.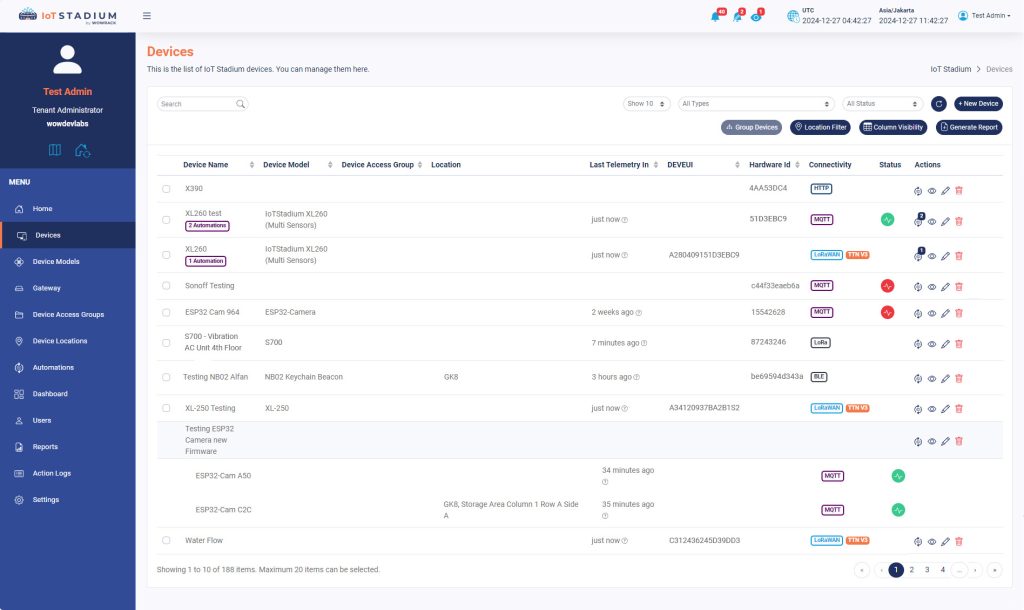
There are several icons and tools which provides an information whether about the device, or a general information on the sidebar and navigation bar.
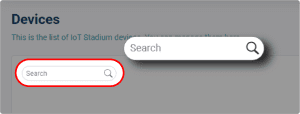
Search Bar
You can type words or phrases to find specific device or devices. It’s like a digital tool that helps you quickly locate things.
Device List Display
Set the preferred display set of device list. You can show the list until 100 devices in one page. Filter the device based on its types. And lastly, set the list based on its status, ranged from connected or disconnected devices, and active or acknowledged alarm.
Refresh
Click it to refresh or update your Devices page. Because sometimes when you make changes on one of your devices, the changes do not appear instantly. In this case, then you need to do a refresh on your page to display the changes you’ve made.
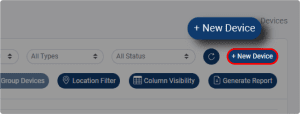
New Device
Group Devices
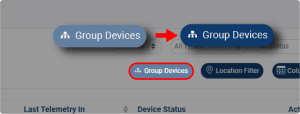
This feature used to group the devices. This feature become available after you checked the small box before your device name.
Location Filter
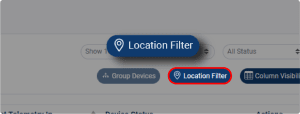
This feature will filter the device based on its location.
Column Visibility
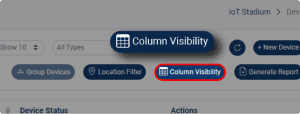
You can set on how much information you want to be displayed. There are 3 columns that can’t be hidden: Device Name, Device Status and Actions.
Generate Report
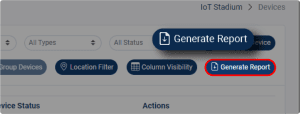
Click to generate report on selected users’ email address.
Action Column
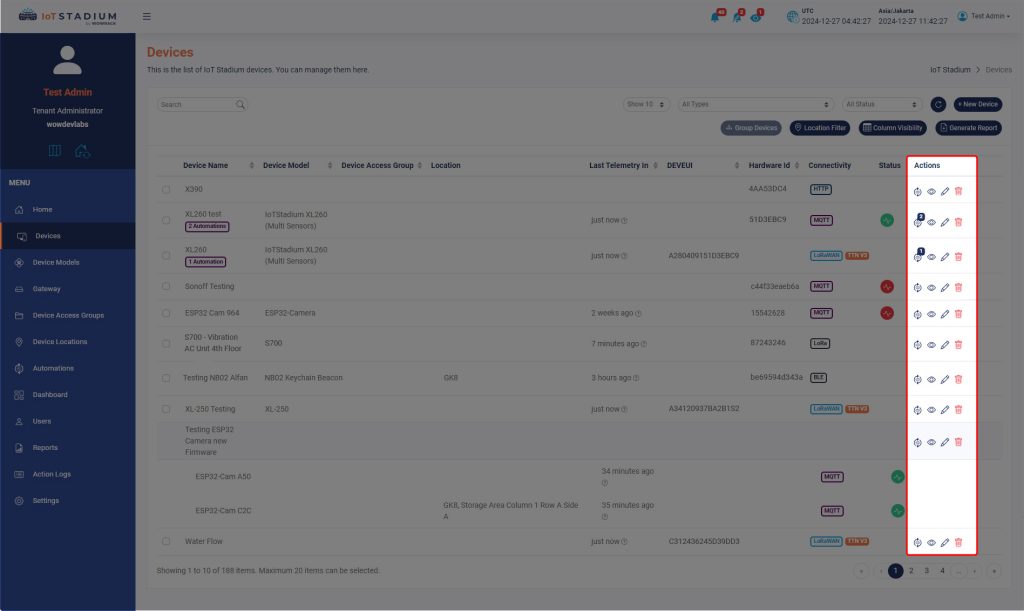
There are three icons under the Action Column: View Device, Edit Device, and Delete Device.
Automation Detail
Click on this icon to view the list of automation created or related with the device. You can also add new automation from the selected device.
View Device
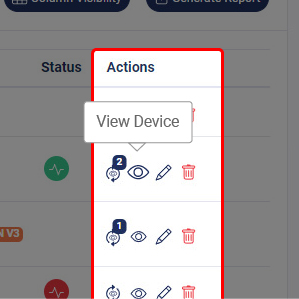
Click on this icon to view the details of your selected device. You can also edit the device by clicking on the pen icon inside the Device page.
Edit Device
![]()
Click on this icon to edit your selected device.
Delete Device
![]()
Click on this icon to delete your selected device.
Device Status Column
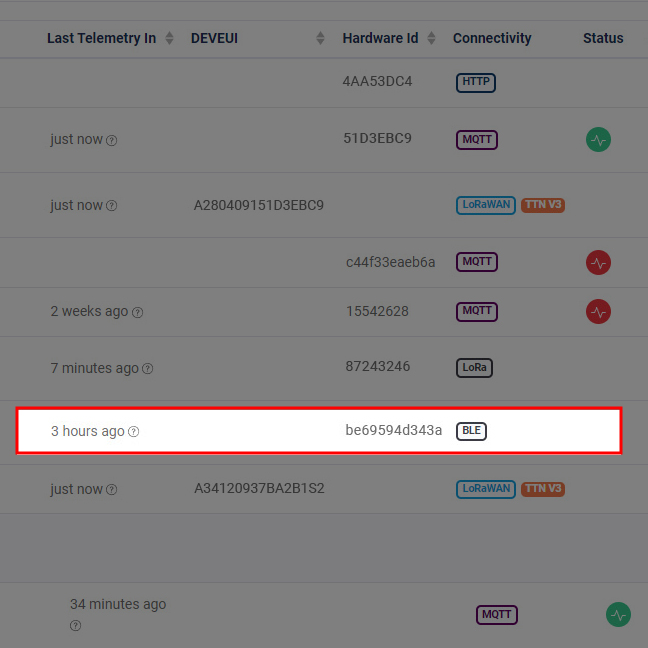
MQTT
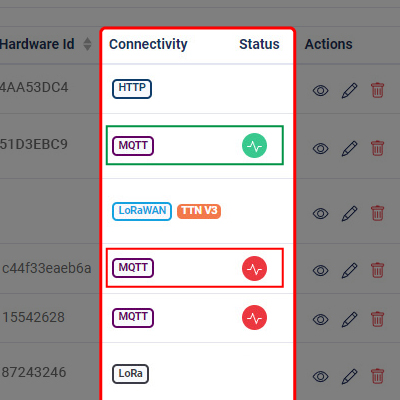
Green if the device is connected with the MQTT. And red, when the connection is disconnected.
HTTP
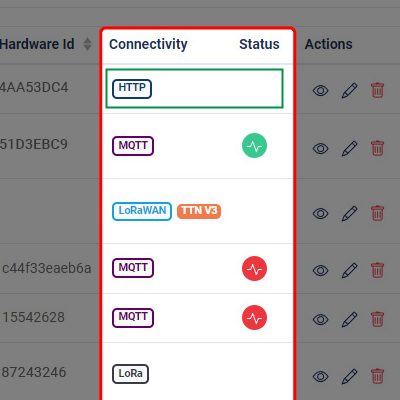
The HTTP icon will always appear as green.
Tips: To check whether the device is connected or not, you can check on Last Telemetry Column.
LoRaWAN
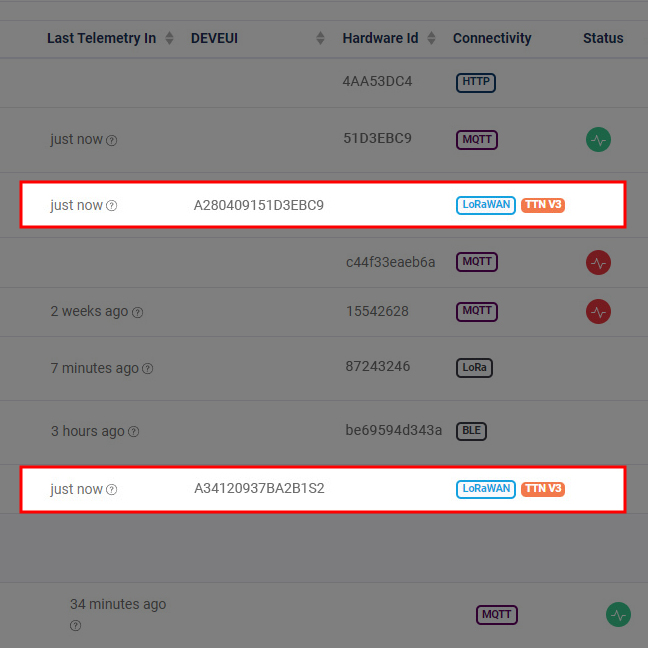
The LoRaWAN icon will always appear with the address of the device network appears on orange box.
Tips: To check whether the device is connected or not, you can check on Last Telemetry Column.
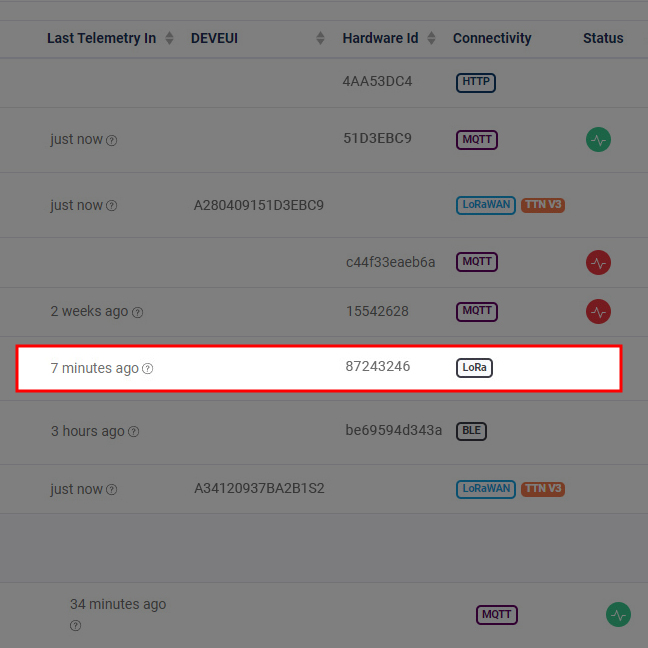
LoRa
The LoRa icon will always appear as it is, only to indicate the selected device using LoRa as its way connect with IoT Stadium platform.
Tips: To check whether the device is connected or not, you can check on Last Telemetry Column.
BLE (Bluetooth Low Energy)
The BLE icon will always appear as it is, only to indicate the selected device using BLE as its way connect with IoT Stadium platform.
Tips: To check whether the device is connected or not, you can check on Last Telemetry Column.


