-
Getting Started
-
Device Management
-
Automations
-
Dashboard
-
User Management
-
LoraWAN
-
API and Integrations
-
Boards
-
DIY
-
Gateway
Graph
In Graph tab, you are able to monitor and download the data from your telemetries.
There are two types of analytics data you could chose: History or Realtime.
Note: The default view is set on History mode.
History
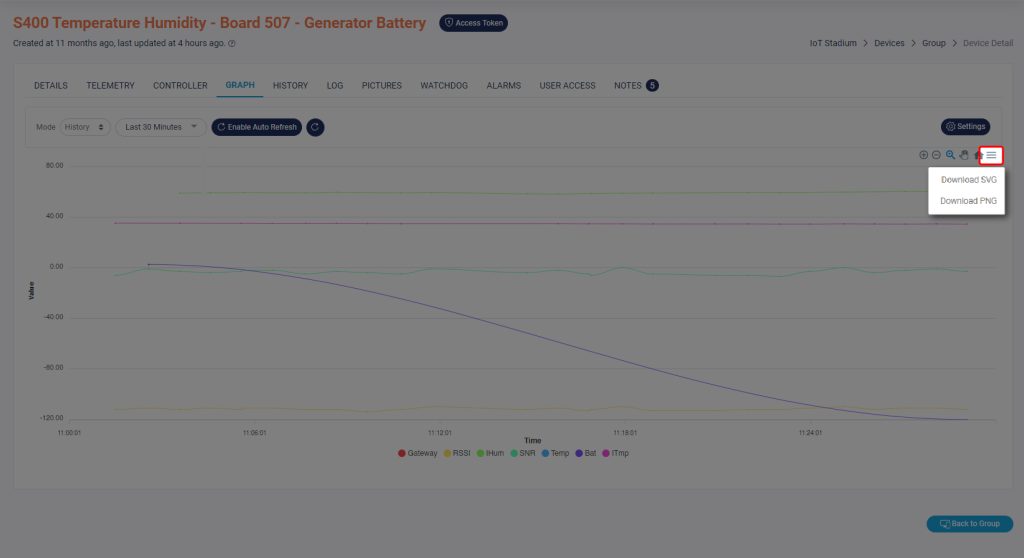
The displayed data based on the sensor reading history–depends on the history limit you set. The default range is 30 minutes.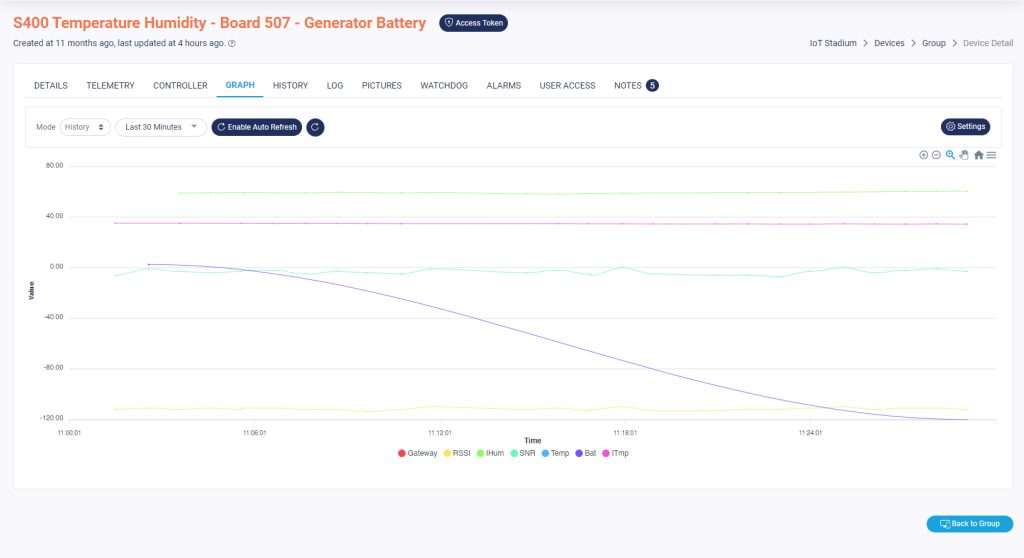
You can download the telemetries graph by clicking on the three bars icon next to the home icon.
Tips: Click Disable Auto Refresh and the data history will be stopped at the time you clicked the icon.
Note: This feature only available on History mode.
History Range
You are also able to set the history range for your data:
1. Click on Last 30 Minutes.
2. Set how long your data history that will be displayed.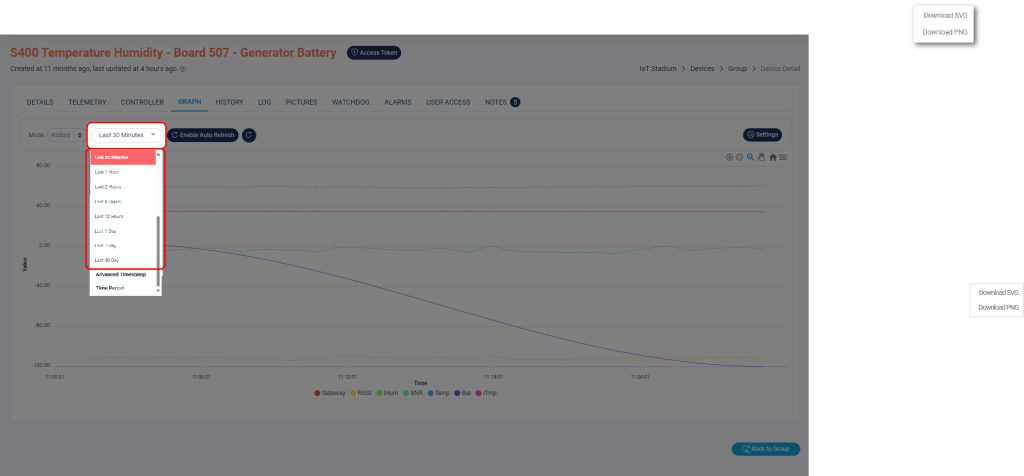
Advanced Timestamp
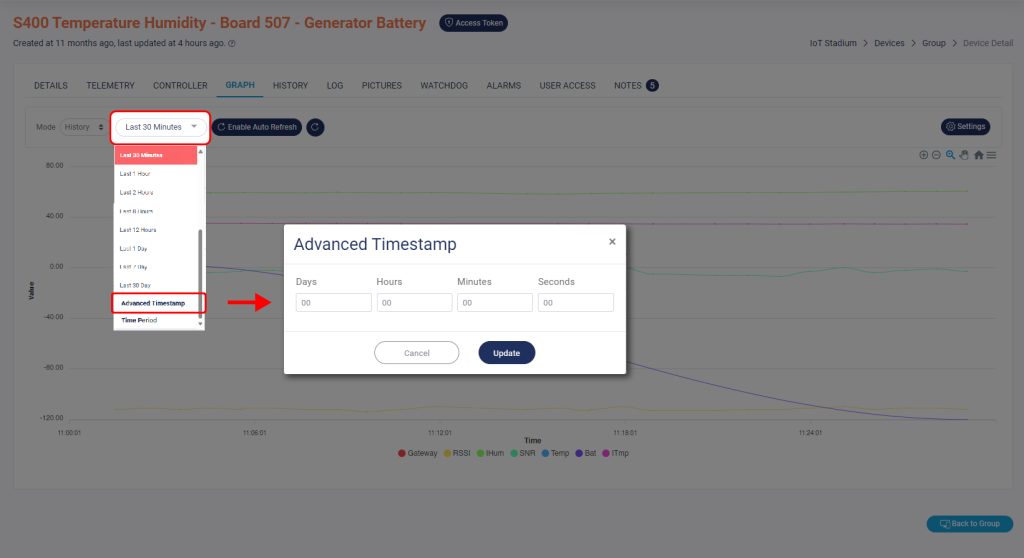
If you want to be more precise on setting the history, or you want to see the data for the last 10 days, you can:
1. Click on Advanced Timestamp.
2. Then you can set your history with more specific time.
3. Click Update when you’re done.
Note: Maximum data range you can set is limited to 90 days.
Time Period
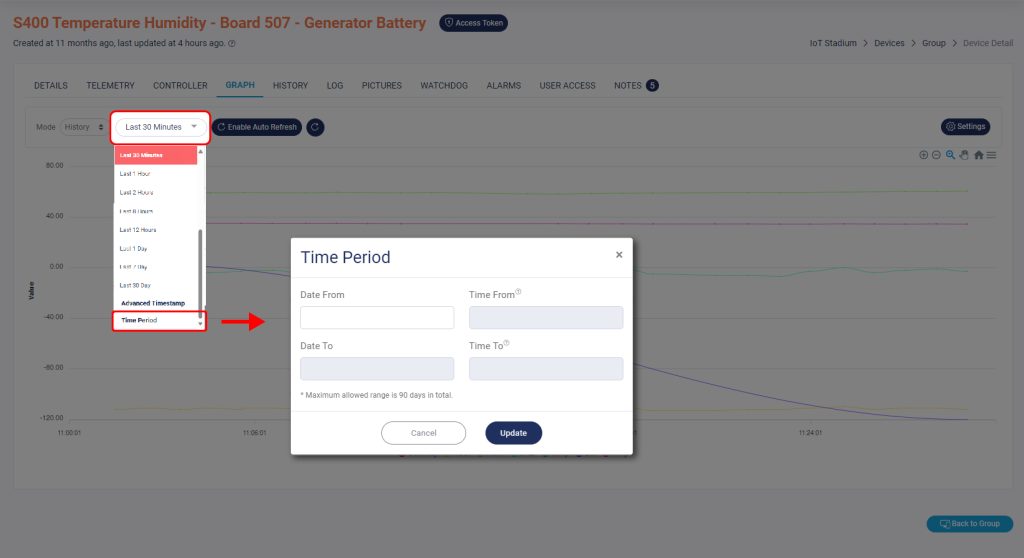
If you want to monitor data for a specific time period, you can:
1. Click on Time Period.
2. Then you can set your history with more specific time.
3. Click Update when you’re done.
Set the start date and time for data recording, then specify the end date and time for data recording. You can only set the start date and time as the date you begin to set, or the date before it. While the end of the end date can only be set on the date you begin to set the data.
Suppose you start setting the historical data on October 3rd and you set the starting date on October 1st. As a result, the maximum end date would be October 3rd at 24.00 or 12.00 PM.
Realtime
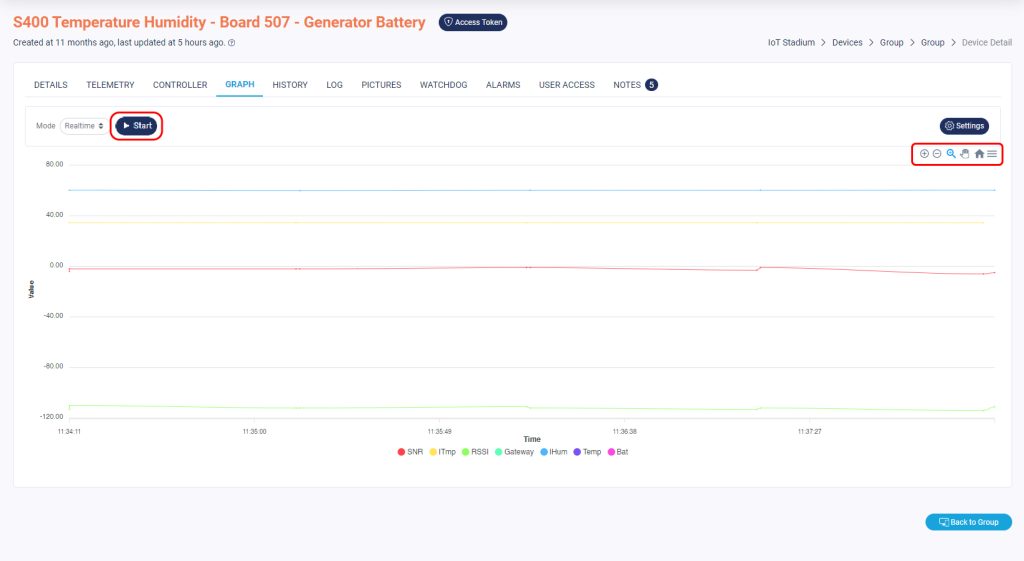
You could also monitor your sensor based on real-time reading.
To do it, set the analytical mode to real-time, by click on the Mode dropdown menu and select Realtime.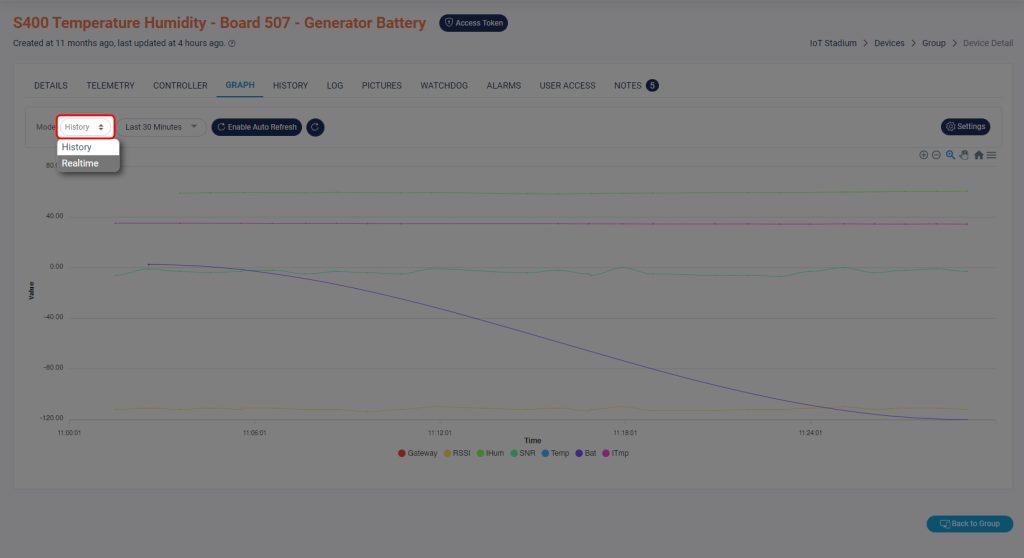
The data will begin to display in real time.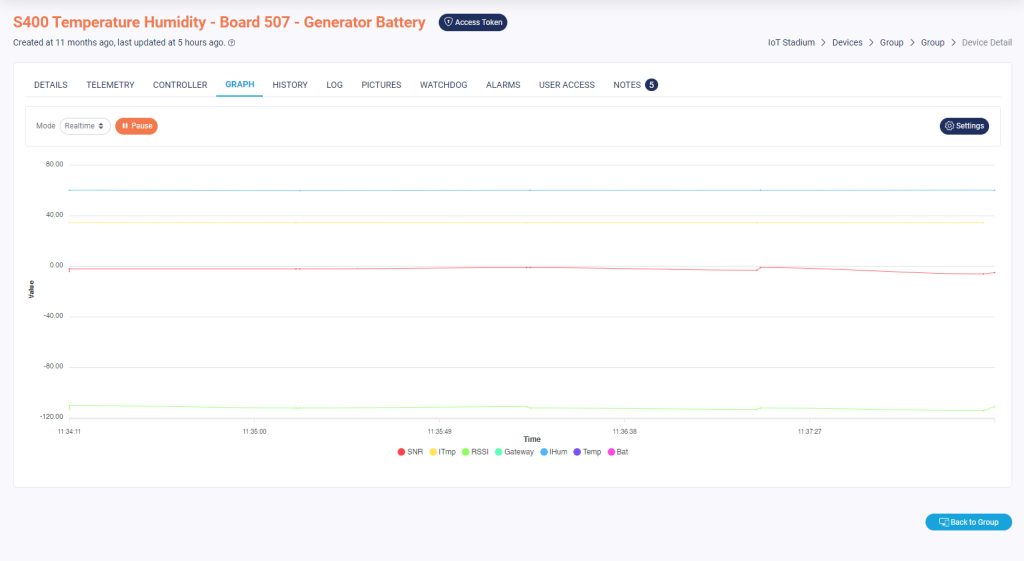
Tips: Click on the pause button to pause the data. Also, you can download the data once you pause it.