Dashboard Map
This widget in the Dashboard menu allows you to place markers to indicate the location of your devices or even telemetries and controllers. You can also set simple automation from the map
To do so, you need to follow these instructions.
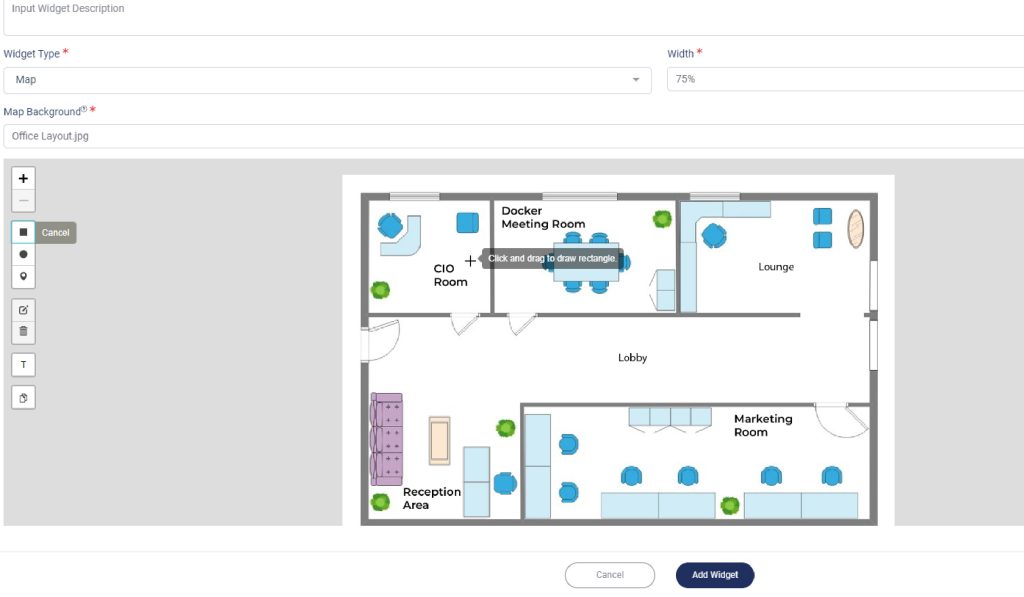
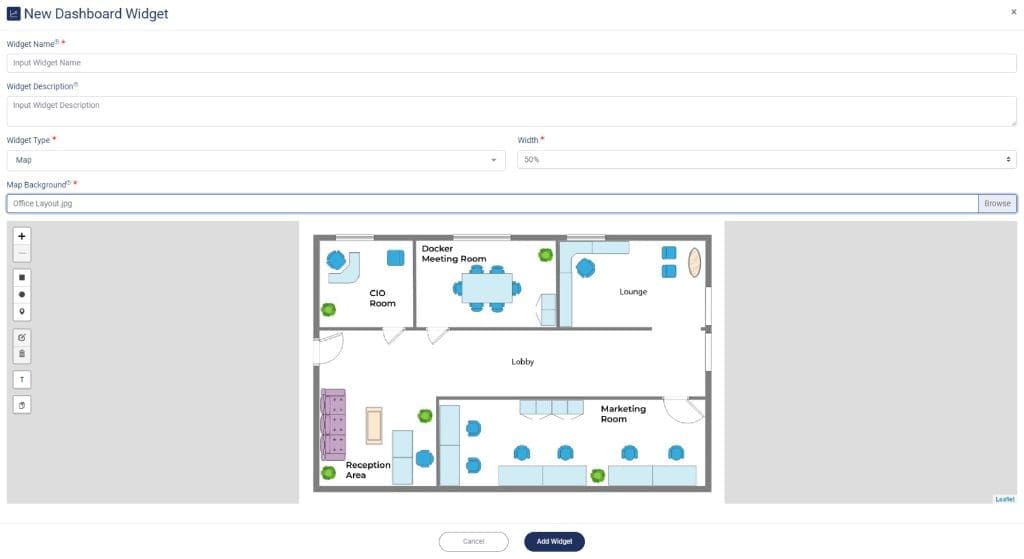
1. Select Map on Widget Type
3. Select your Map on the Map Background.
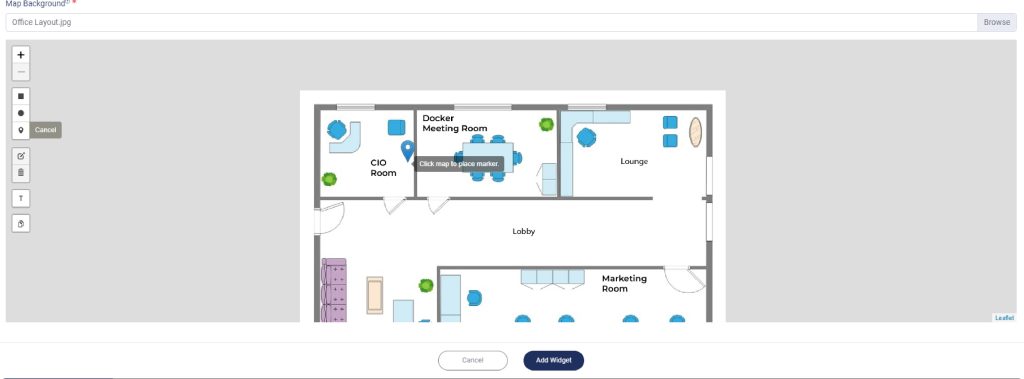
4. Draw a label or drag the marker to mark the specific location.
Labeling
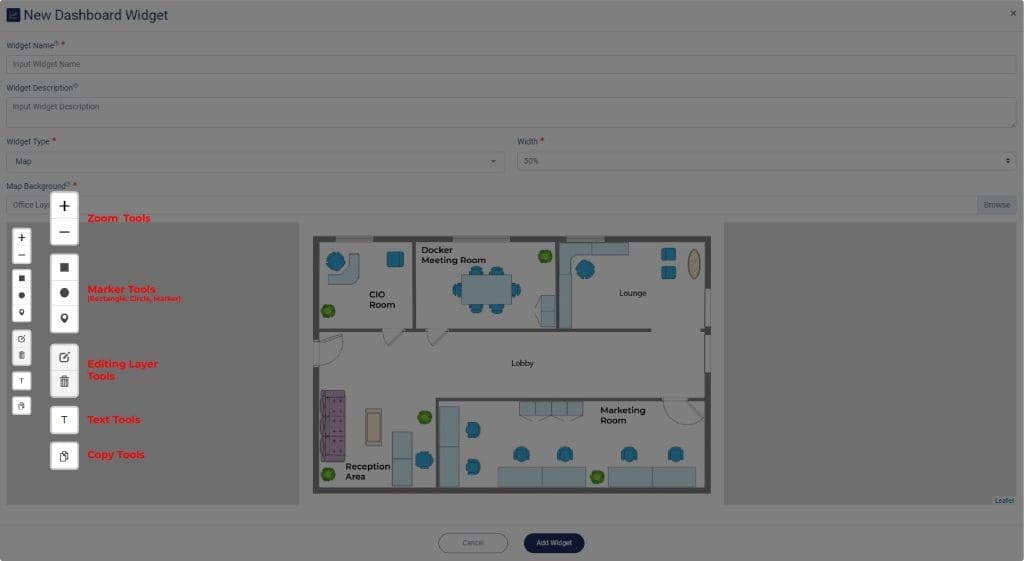
There are three options to mark your map: rectangle, circle, and marker. You can use the mouse scroll or click on the ‘+’ or ‘-‘ icon to zoom in or out on the map. The Text Tool is used to make a label with text, while the Editing Layer Tools are used for editing where you can move, resize or delete your selected Marker Tools. Also, you can copy any label or text using Copy Tool.
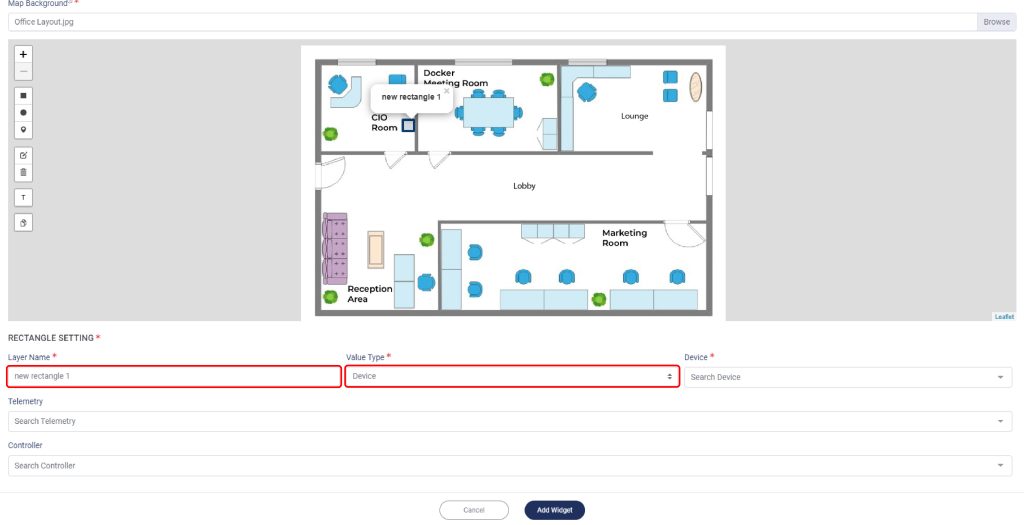
Rectangle and Circle
1. Select on Rectangle or Circle.
3. Give its name.
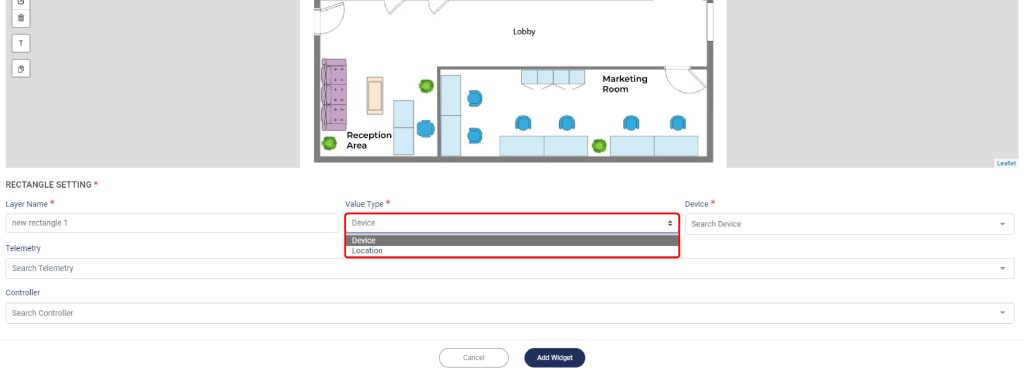
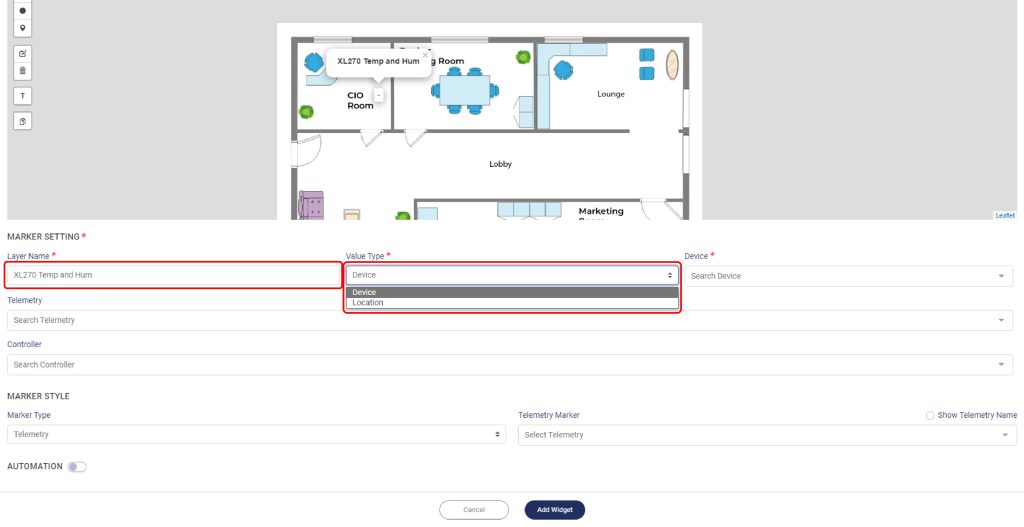
From the Value Type you can choose between Device or Location; each type has different options.
Device
2. Set the Telemetry or Controller.
Tips: If your Device have both telemetry and controller, you may set which telemetry or controller that you want.
Note: You can select more than one telemetry or controller.
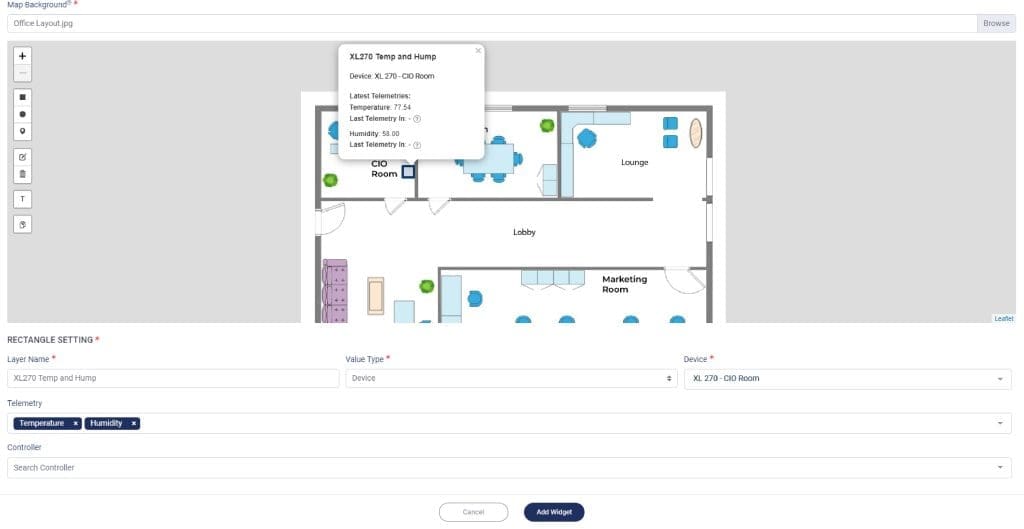
3. Click Add Widget when done.
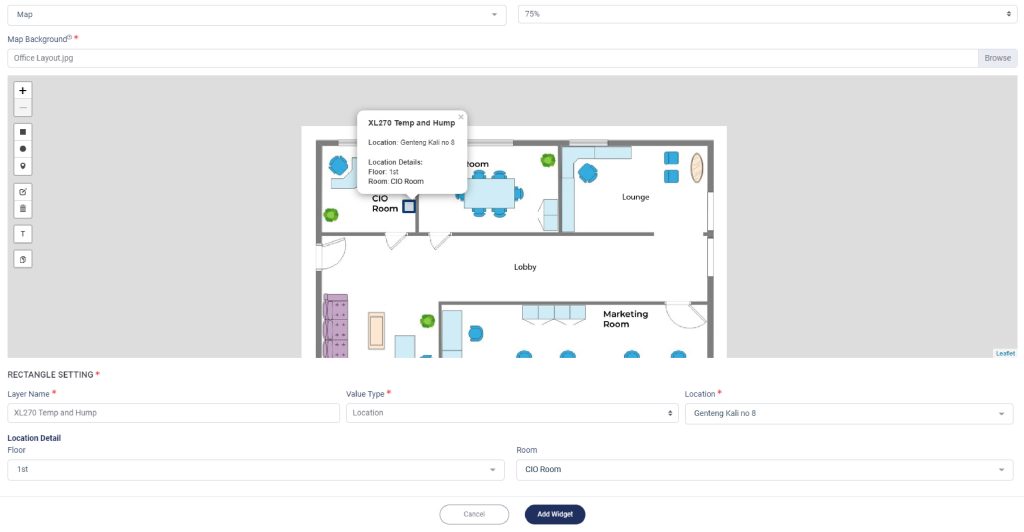
Location
2. Click Add Widget when done.
Marker
1. Select on Marker.
3. Give its name.
Device
1. Select your Device.
2. Set the Telemetry or Controller.
Tips: If your Device have both telemetry and controller, you may set which telemetry or controller that you want.
Note: You can select more than one telemetry or controller.
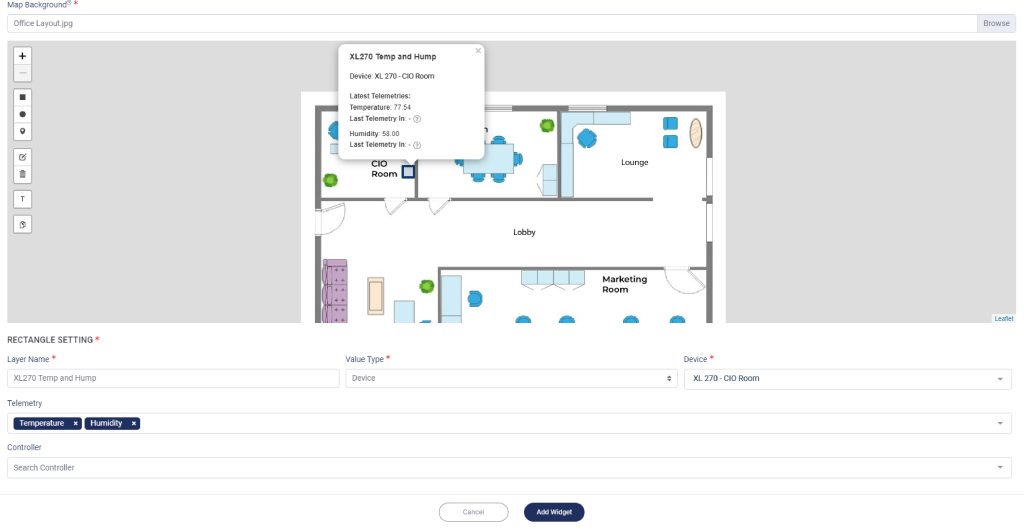
3. Select the Marker Type.
There are two options on Marker Type: Telemetry and Image. By selecting Telemetry your selected telemetry will be displayed on the widget. While, if you chose Image, the selected image will be displayed on the widget, and this option is recommended when you also include a controller in your widget.
You can also set an automation from this feature.
Telemetry
1. Select your Telemetry.
Tips: Check the box to show your telemetry’s name.
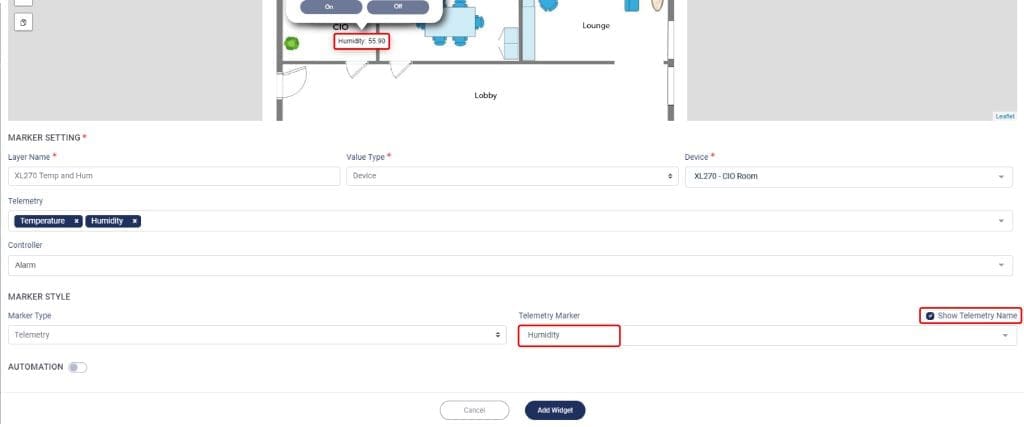
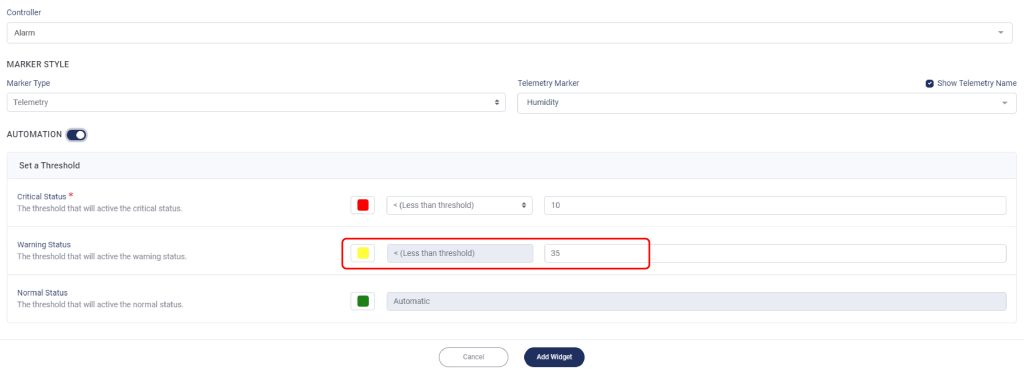
2. You can go to Add Widget, or you can add the Automation for your widget.
3. If you want to add the Automation, slide the button.
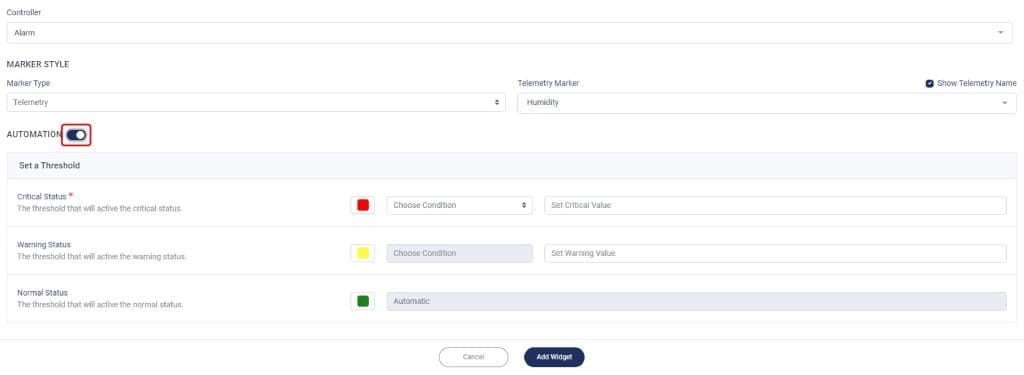
4. Set the color for the Critical Status.
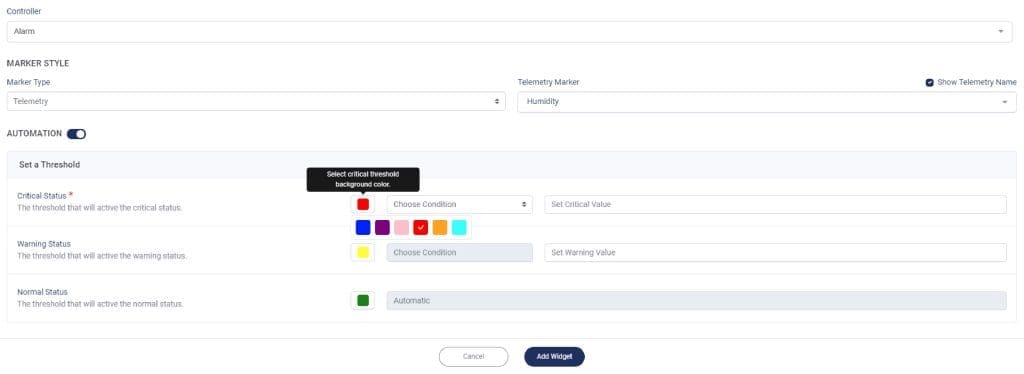
5. Set the Critical Status Condition and set its Value.
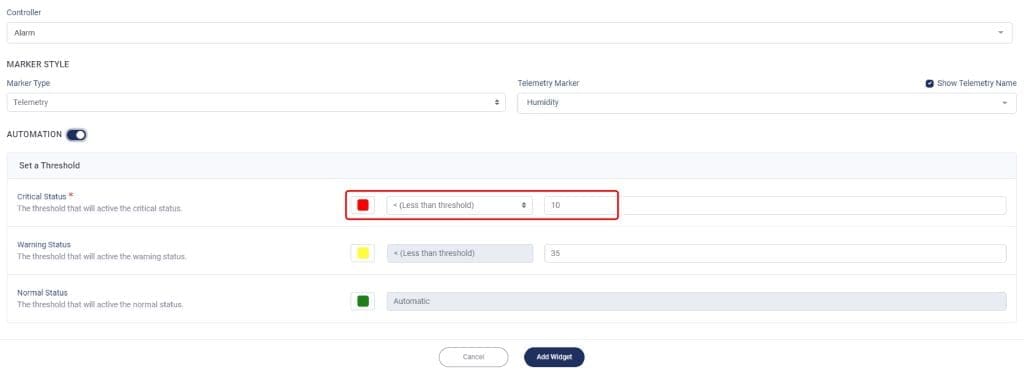
6. Set the color for the Warning Color.
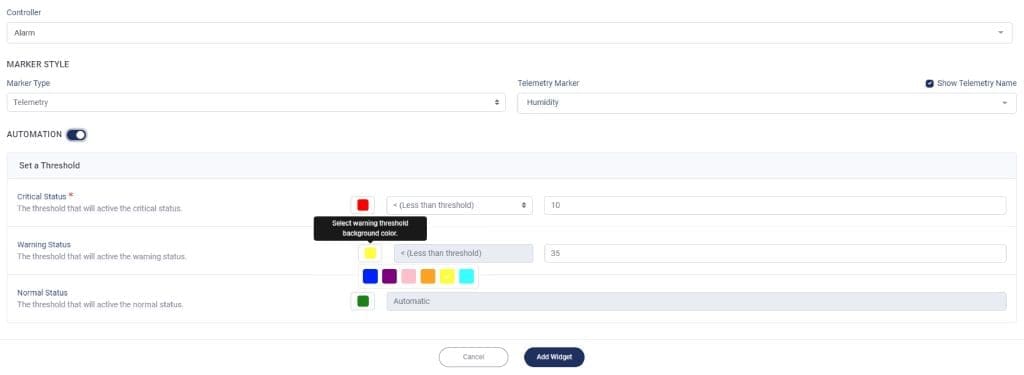
8. Set the color for the Normal Status.
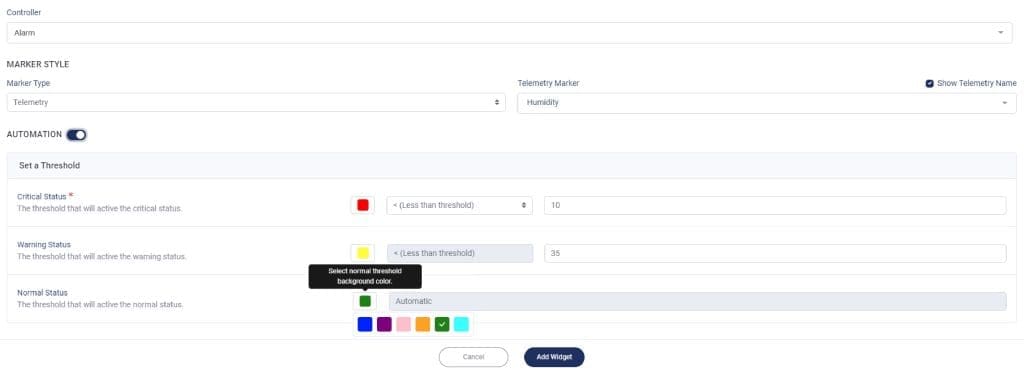
9. Click Add Widget when done.
Note: If you set the Critical Value as Equal or Not Equal, you don’t need to set the Warning Status.

Image
1. You can use your own image/icon, or you can use the default marker icon.
2. You can go to Add Widget, or you can add the Automation for your widget.
3. If you want to add the Automation, slide the button.
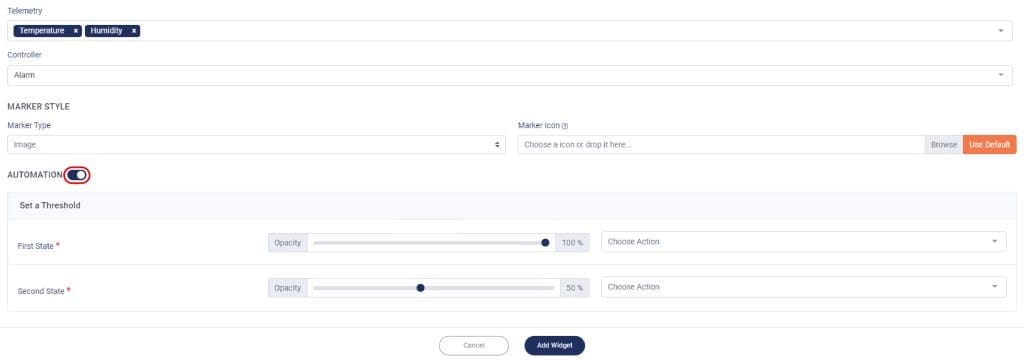
4. Set the First State Opacity and set its Action.
5. Set the Second State Opacity and set its Action.
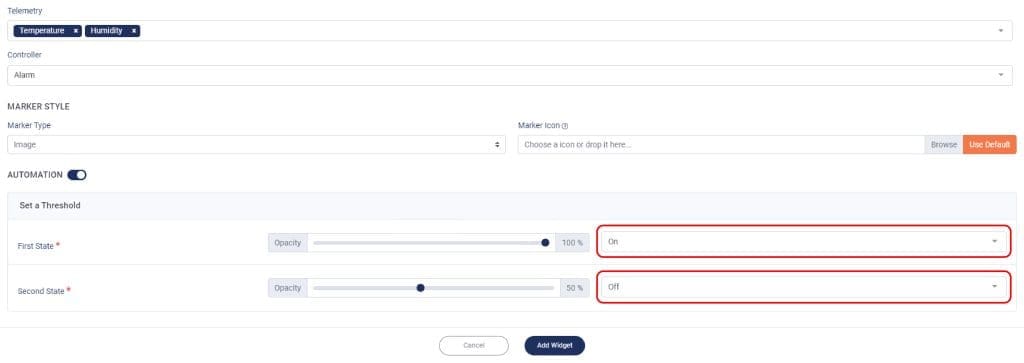
6. Click Add Widget when done.
Location
1. Set the Value Type as Location.
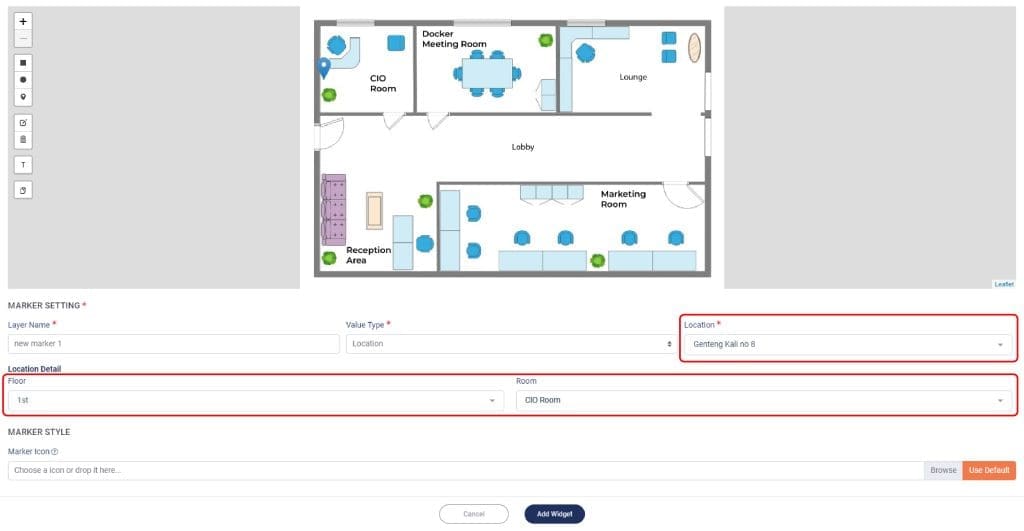
2. Select your Location.
3. Add Location Detail if you already have the detail of your selected location.
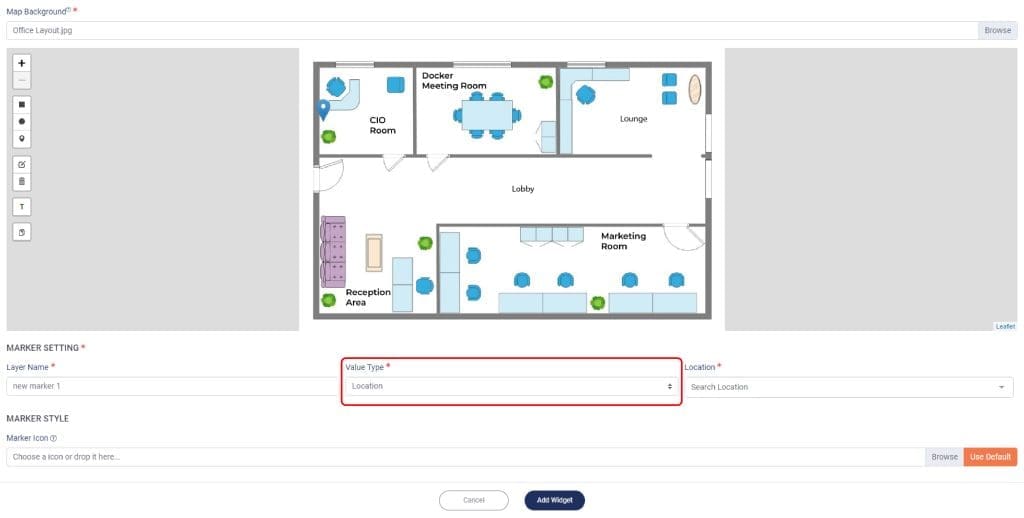
4. You can also use your own image/ icon, or you can use the default marker icon.
![]()
5. Click Add Widget when done.


