-
Getting Started
-
Device Management
-
Automations
-
Dashboard
-
User Management
-
LoraWAN
-
API and Integrations
-
Boards
-
DIY
-
Gateway
Alarms
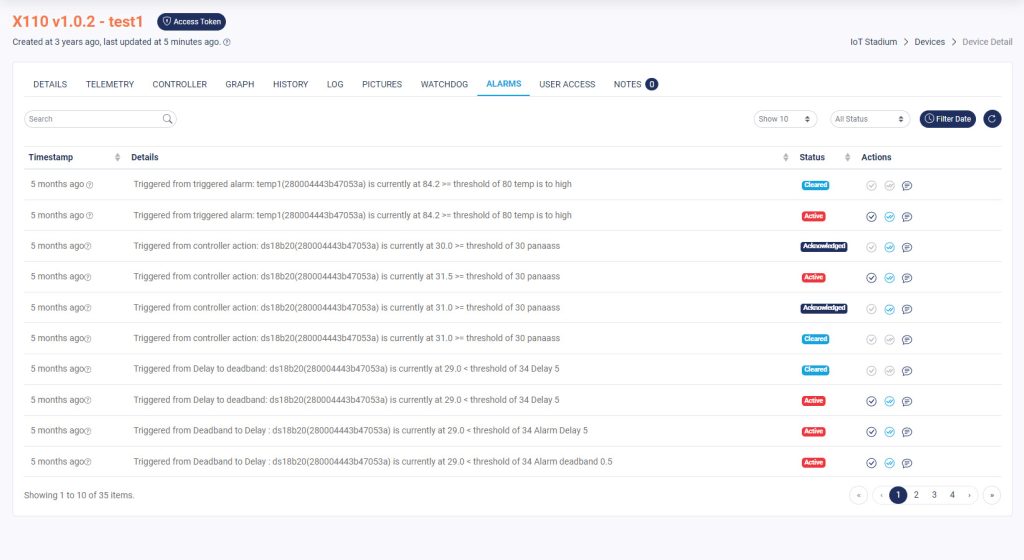
The Alarms tab will be filled with the list of alarms you’ve already set on the Automation menu. This page will be filled with the action and the time the alarm occurred.
*Note: the page will be empty when there is no Automation set for the selected device.
Seach Bar
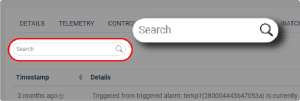
You can type words or phrases to find specific telemetry or telemetries.
Alarm List Display
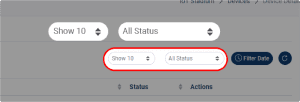
Set the preferred display set of the alarm. You can show the list until 100 alarms in one page. And filter the alarm based on its status, ranged from Active, Acknowledged, or Cleared.
Filter Date
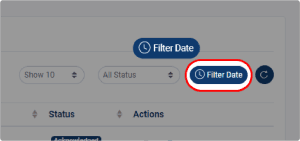
You can set the history range for your data.
Refresh
![]()
Click it to refresh or update your Alarm page.
Status Column
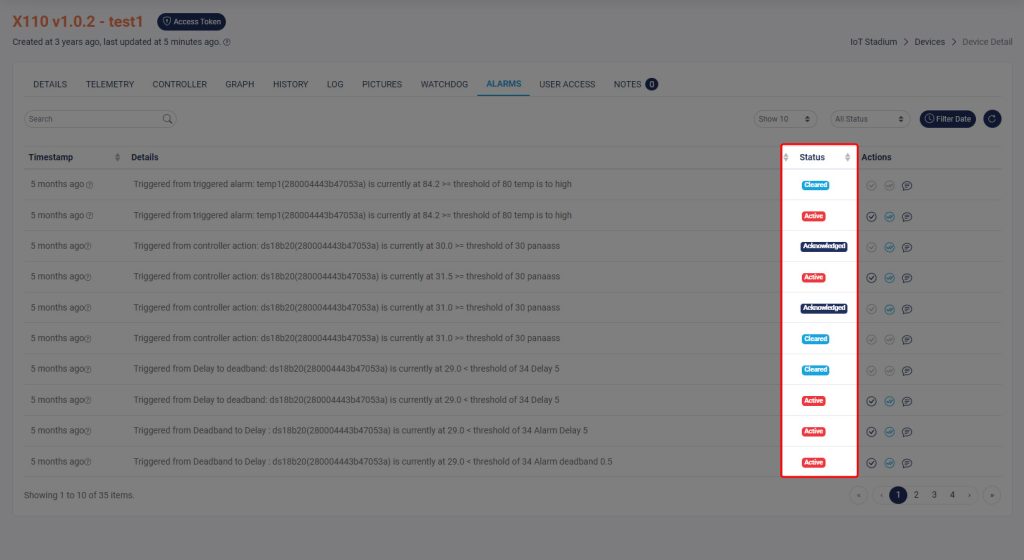
The status of the alarms is connected with the three icons on the top bar.
Active
The alarm still active and no one is acknowledged it.
Acknowledged
The alarm already acknowledged but still uncleared and it will be moved to suspend.
Cleared
The alarm already cleared.
Action Column
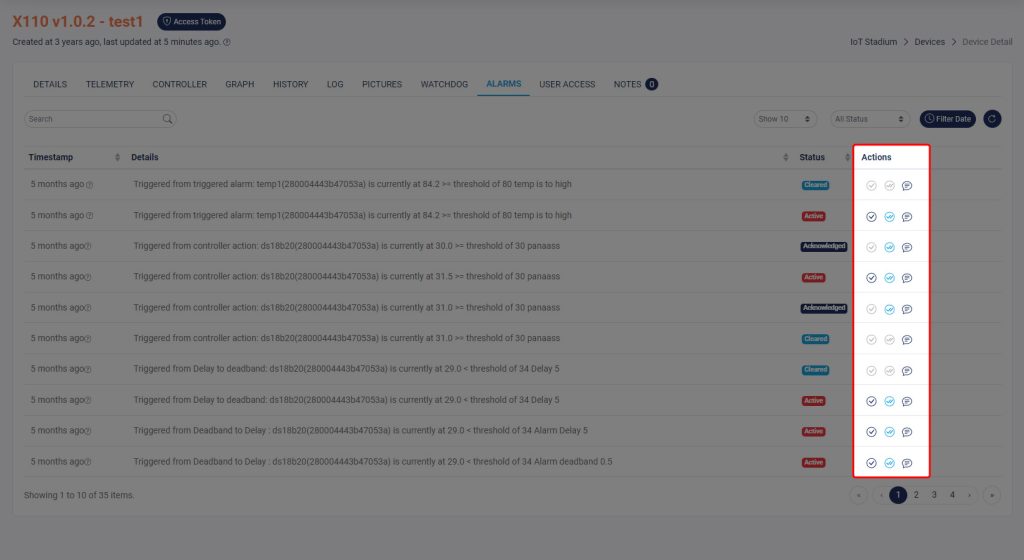
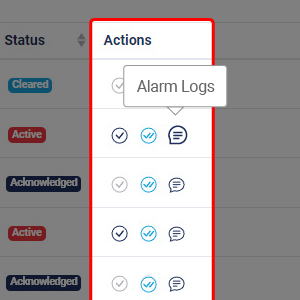
There are three icons below the Action Colum: Acknowledge, Clear, and Action Log
Acknowledge
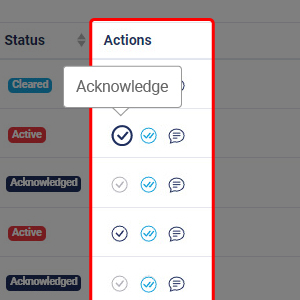
Click this icon to acknowledge the active alarm.
Clear
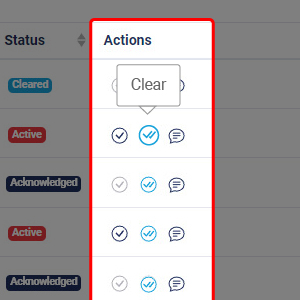
Click this icon to clear the alarm status.


