Add and Set the Dashboard
The Dashboard landing page will be filled with the list of Dashboard you’ve already created. There will be two steps to create new dashboard:
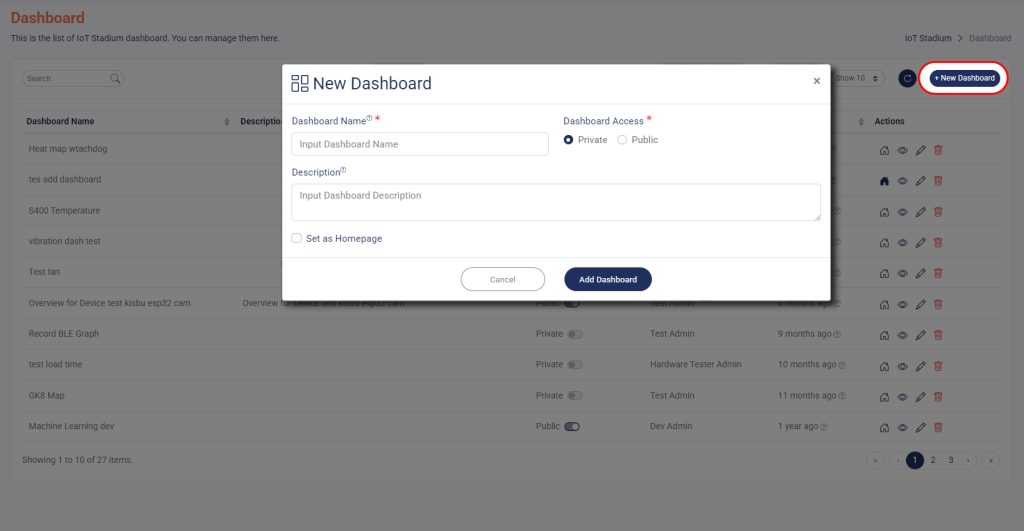
Add New Dashboard
1. Click on New Dashboard.
2. Give the name and description for your dashboard.
3. Set whether you want to set your dashboard as Public or Private.
4. Click Add Dashboard when done.
The Dashboard Access option allows you to set a restriction for your dashboard. When you set the access to Private, it is accessible only to you and all users in the same tenant as you. When the dashboard access is set to Public, you could share the link of your dashboard to anyone who has an IoT Stadium account.
Add Widget
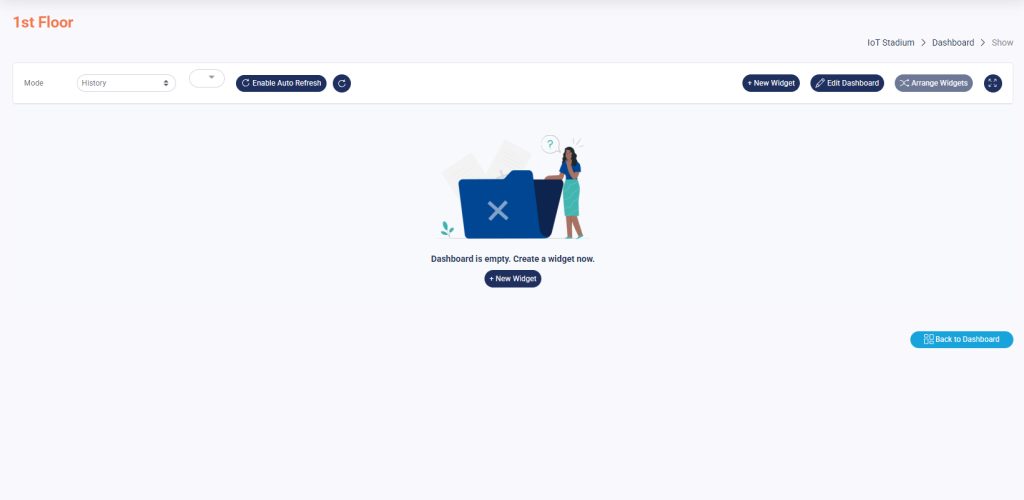
Your Dashboard may have been added, but there is still no widget inside of it.
1. Click the View Dashboard button next to your dashboard name.
*Note: If you click Edit Dashboard, you will be taken back to the New Dashboard page.
2. You will get into this page
3. Click New Widget.
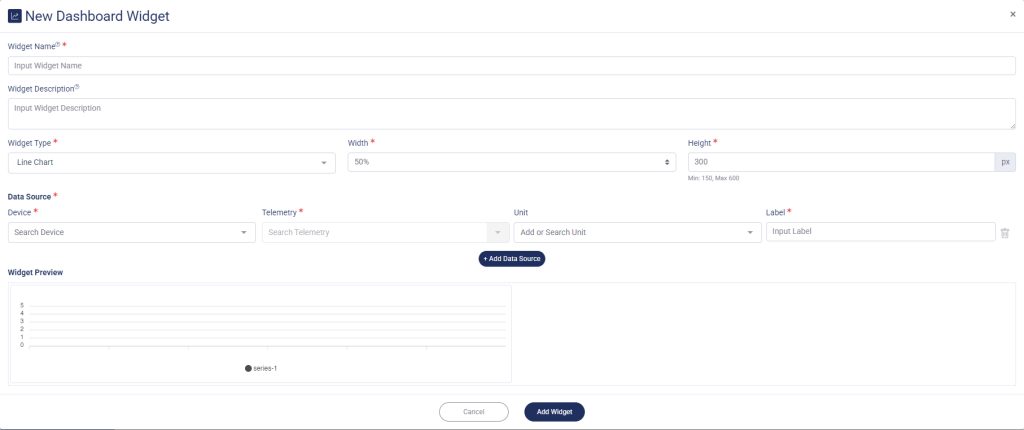
4. Give the name and description for your widget.
*Note: You can also choose more than one data source, and the widget will display the graphic.
5. Set your Data Source: your device, telemetry, and unit, and label it.
6. Each Widget Type has a distinct advantage for a specific use of data compiled by your selected telemetry.


