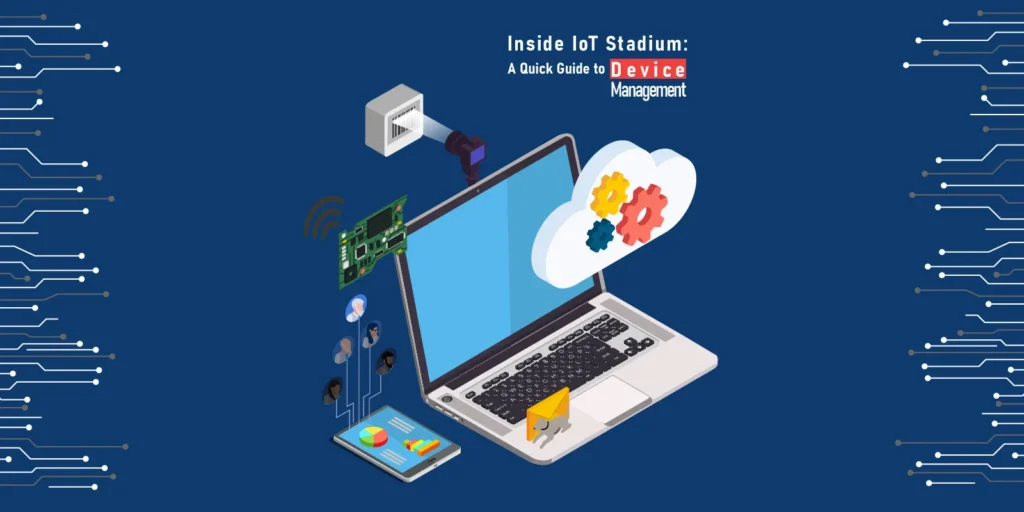
Whether you're using our devices or connecting your own DIY device, it's important to understand how Device Management works on IoT Stadium. We'll give you a complete overview and guide you through the process of connecting your device and adding new telemetry.
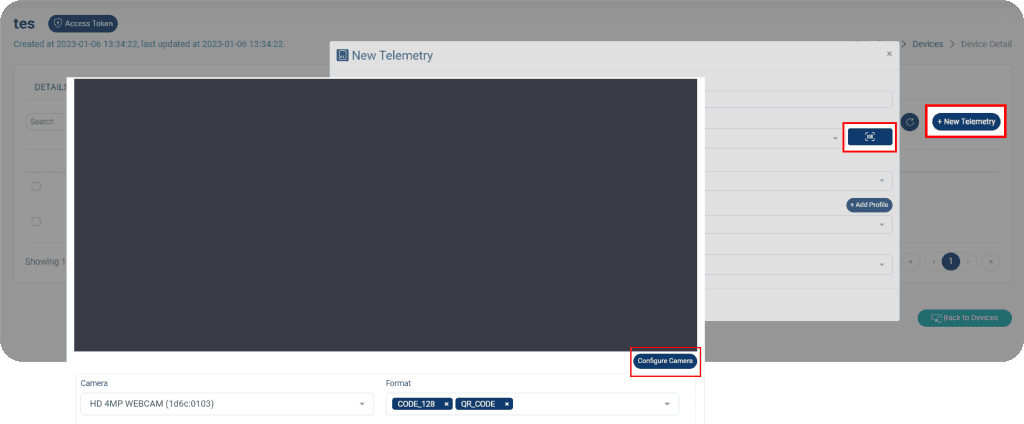
You can easily add new telemetry to your device, even using your own camera. Our platform can scan your telemetry as long as it has a barcode attached.
Connect Your Device
Whether you're using our product or your own device, you can easily connect it to our platform. Each device comes with a unique Access Token and Device ID, which work like keys to let you access our platform.
All you have to do is copy those tokens to your device's firmware, compile it, and you're good to go! The whole process takes just a few minutes, usually five or less.
Add The Telemetry
Once your device is connected to our platform, all of its telemetries will be automatically uploaded. You can then specify the units for each of the telemetries.
In case you need to manually add a new telemetry to your device, you can do so easily using IoT Stadium. Just click on the New Telemetry button and set its Telemetry Key. You can also use your device's camera to scan the code, and our platform will assist you in scanning it based on the type of barcode.
Group the Telemetries
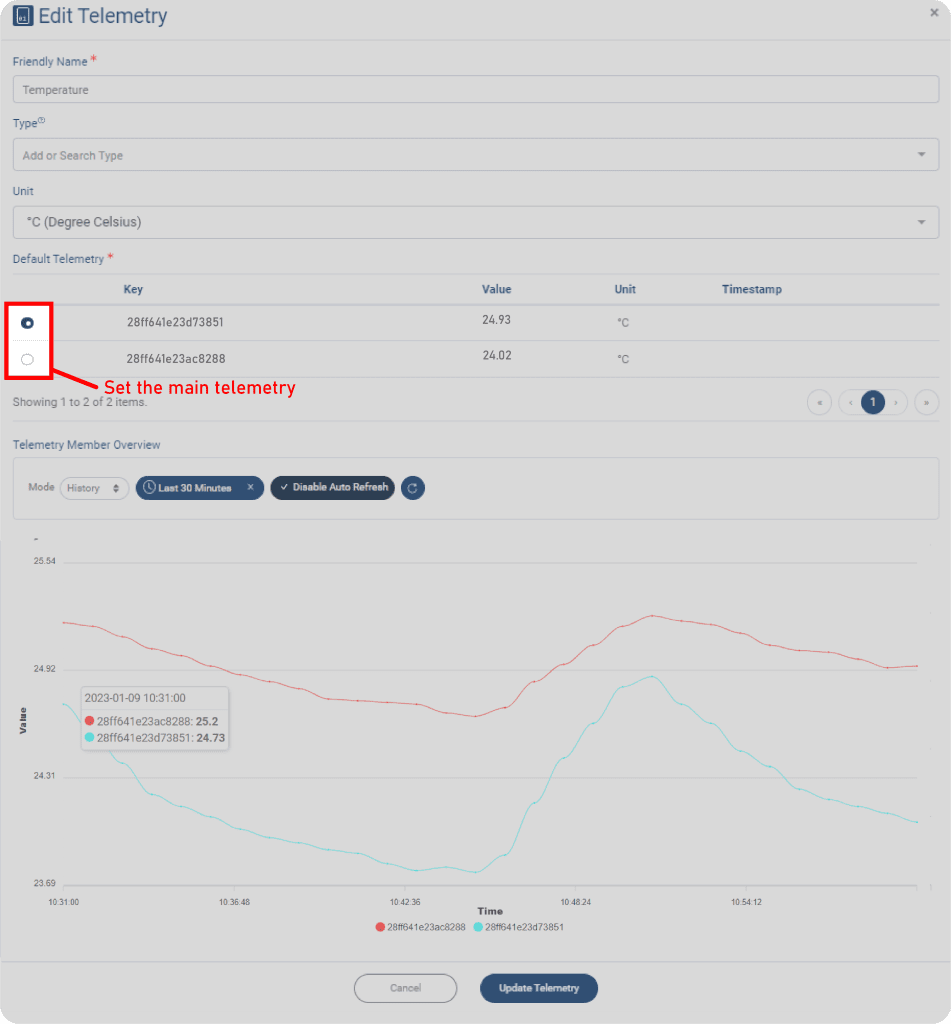
Once all of your telemetries have been uploaded, you can group multiple telemetries together. This is particularly useful if you have several telemetries in the same location that read the same data, which is known as sensor redundancy.
In addition, you can specify which telemetry will serve as your device's primary input, which can help with sensor redundancy. A line chart displaying your grouped telemetry can also be found on this page.
Download your Data
You are able to download the data from your device. This data can then be used for further analysis.
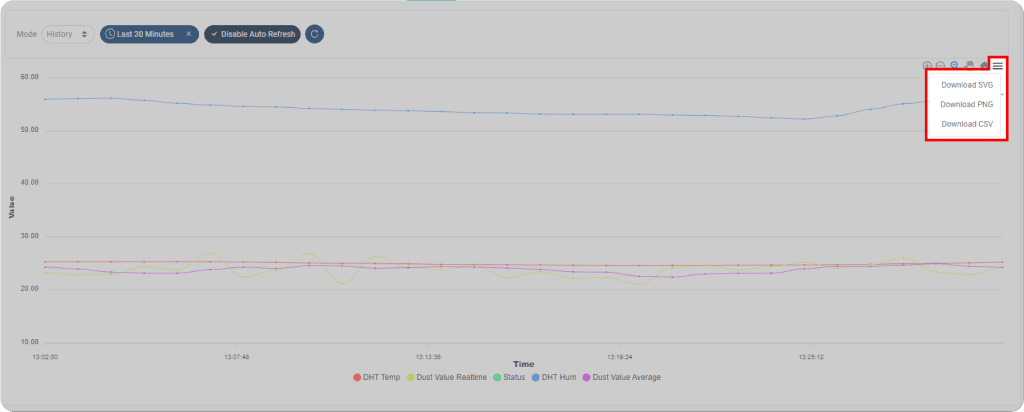
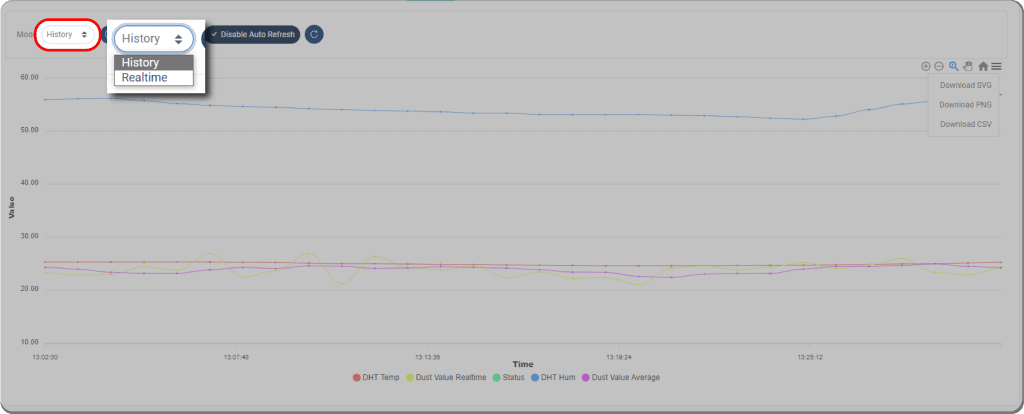
When you select the History option, the data available for download depends on the timeframe you set. To ensure efficient data management, we have set a maximum historical data limit of 90 days for download.
On the other hand, if you select the "Realtime" option, you can simply pause the data stream to download the data.
Create the Widget
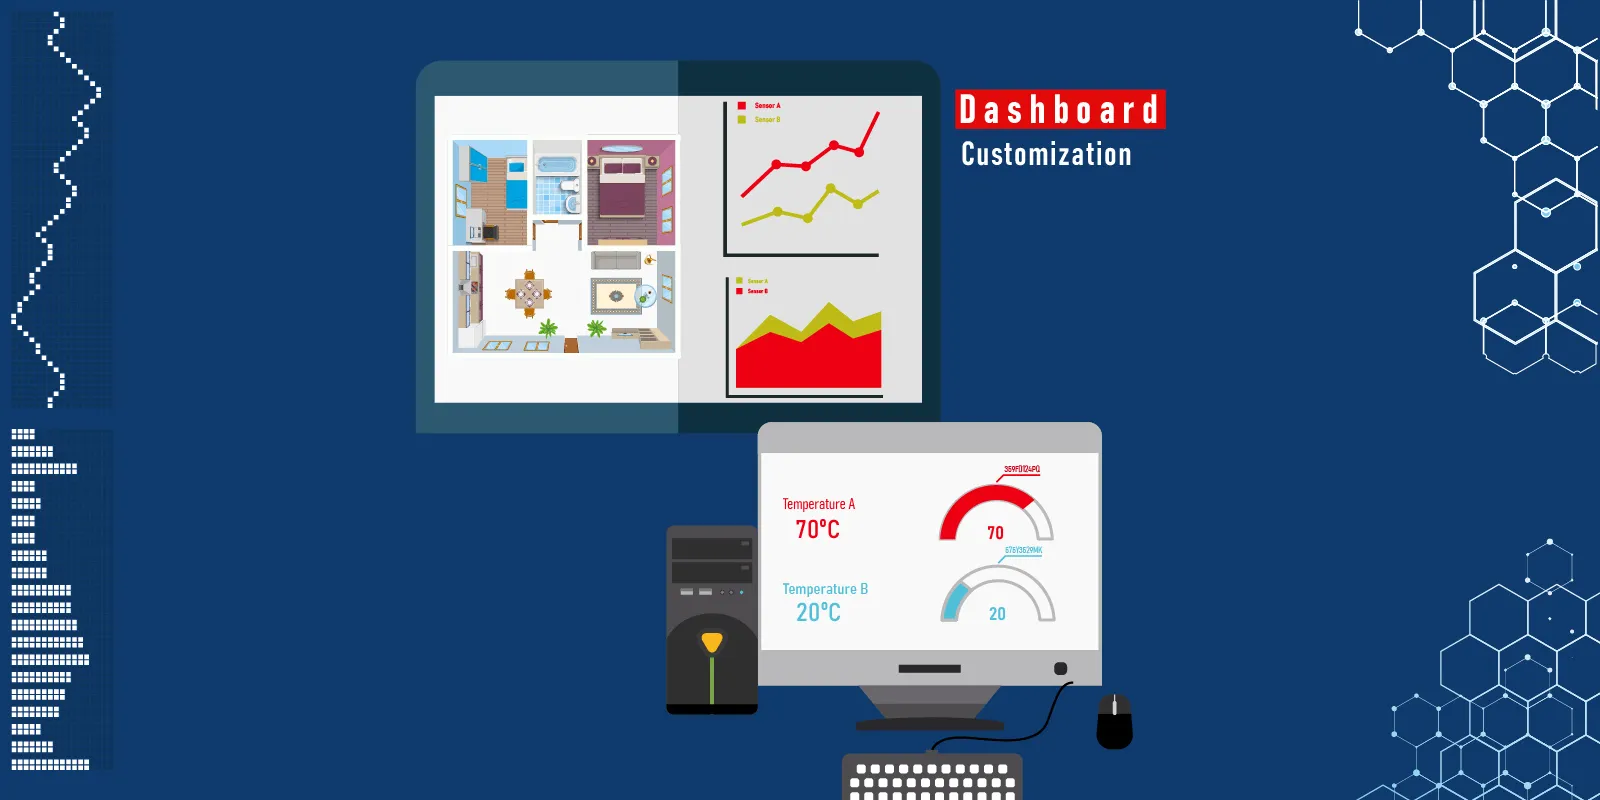
After your device is connected to our platform, all the data collected by your device's telemetry sensors will be automatically uploaded and displayed on the GRAPH page as a line chart. However, you can also create a widget to display telemetry data or multiple telemetry data points on the Dashboard menu.
There are several types of charts to choose from, each with its own advantages depending on the number of telemetries selected and the measurement data collected. For example, the bar chart is useful for comparing multiple data points, while the gauge chart can help in monitoring the fluctuation of single data.
Set the Watchdog
You have the option to designate one or more users to receive reports from your device. Our platform will assist you in calculating the average data from your telemetry, based on the interval you set for checking. This feature is particularly useful for monitoring the condition of your device, as well as the variables measured by your device.
Set the User Access
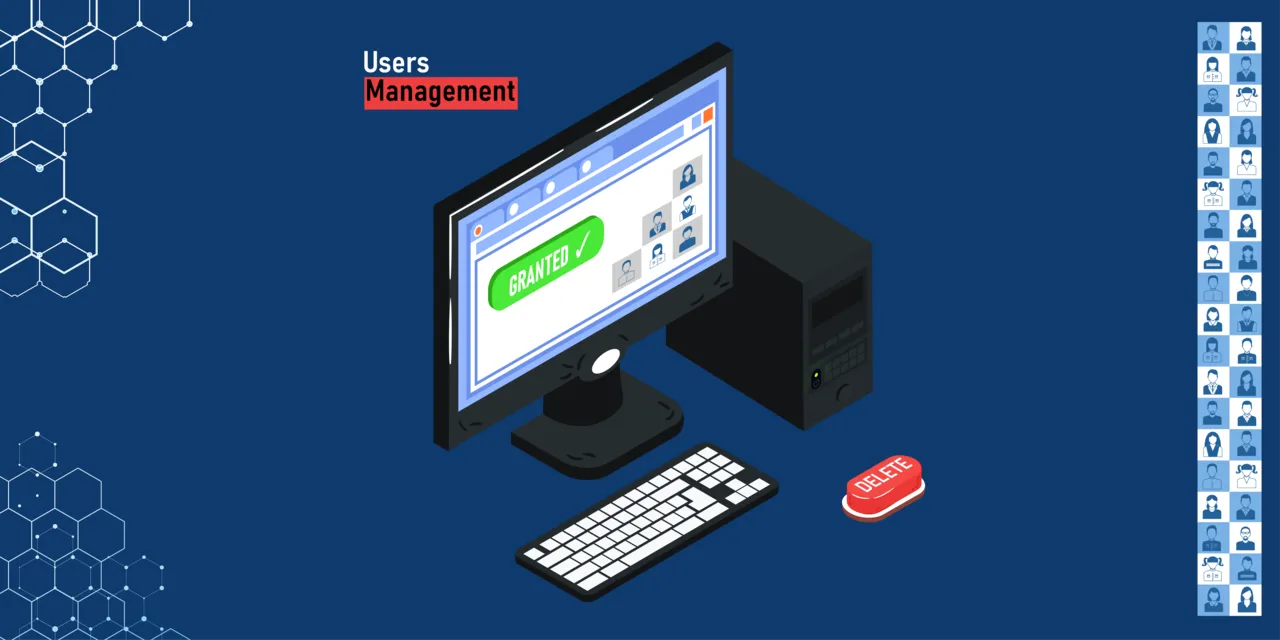
Our platform has three different types of user roles: Tenant, Admin, and User. The Tenant has the highest level of access while the User has the lowest.
Users have limited access to the platform and can only access certain features if granted permission by a Tenant or Admin. Users can have two types of access: read or write.
-
- Read: The User only able to see what’s inside the Devices menu, from the selected device.
- Write: The User can make changes to the selected device or devices.
Device Access Group
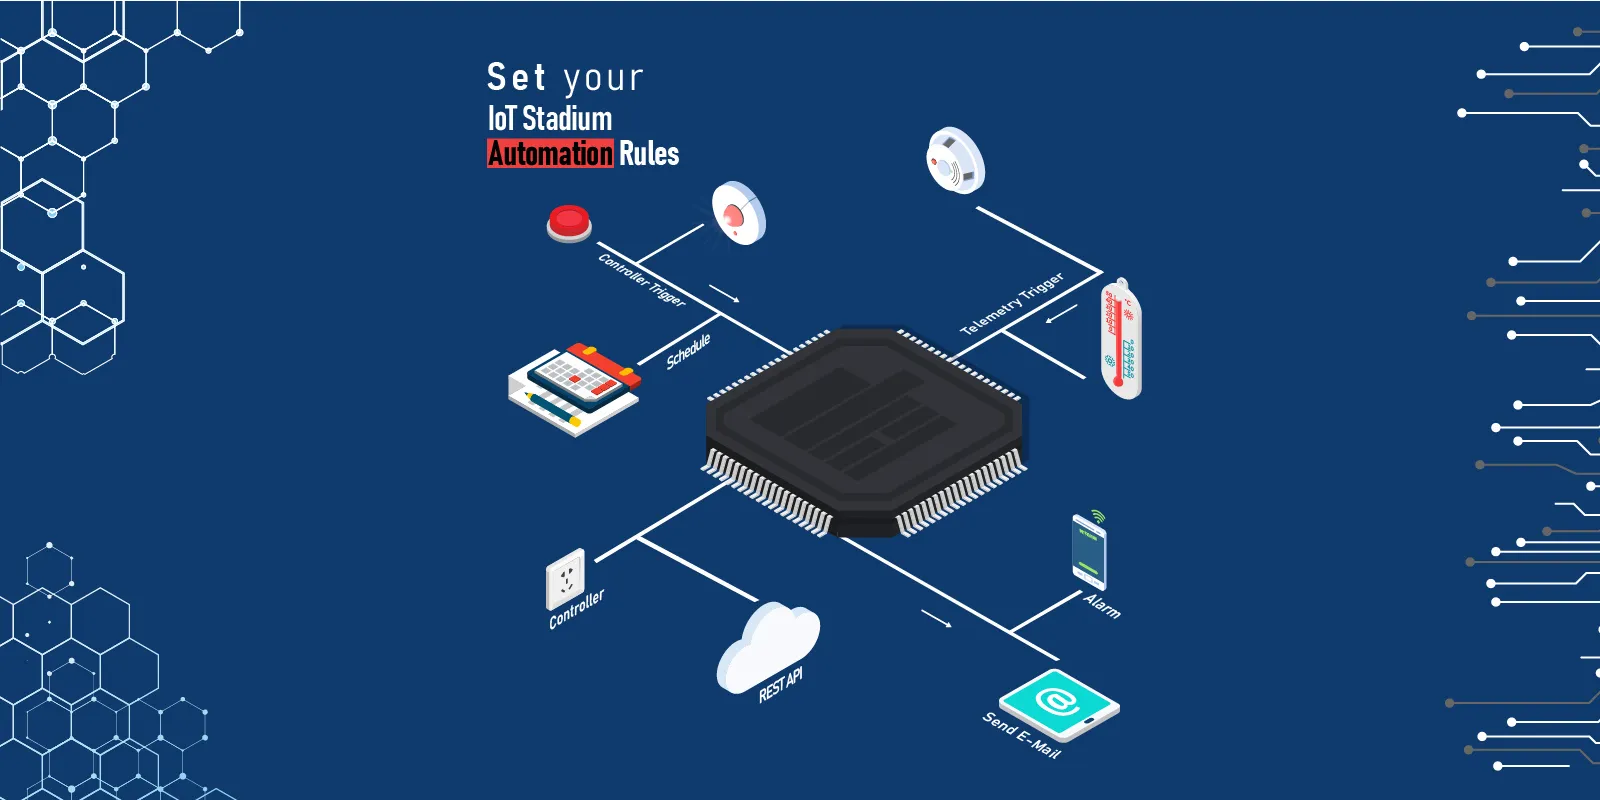
This grouping feature is particularly useful for redundancy purposes or when granting access to multiple devices for a User. You can organize devices based on their function or the automation rules you've created, depending on your preferences.
