Getting Started
IoT Stadium is an IoT-based platform that provides a location-based dashboard that integrates with real-world maps. By connecting device locations directly to their actual positions on a map, we aim to offer users an intuitive and seamless monitoring experience. This integration simplifies the monitoring process, allowing users to track and manage their IoT devices easily in real time, enhancing visibility and efficiency.
Within this knowledge base, you'll discover various resources with helpful information designed to assist you in navigating your IoT solution. Explore insights on utilizing the IoT Stadium platform and gain valuable tips. In essence, this resource is tailored to provide you with the necessary information to enhance your understanding of how to use our platform effectively.
Here is the process which you need to do before monitoring your devices in IoT Stadium, please take a look at the flowchart:
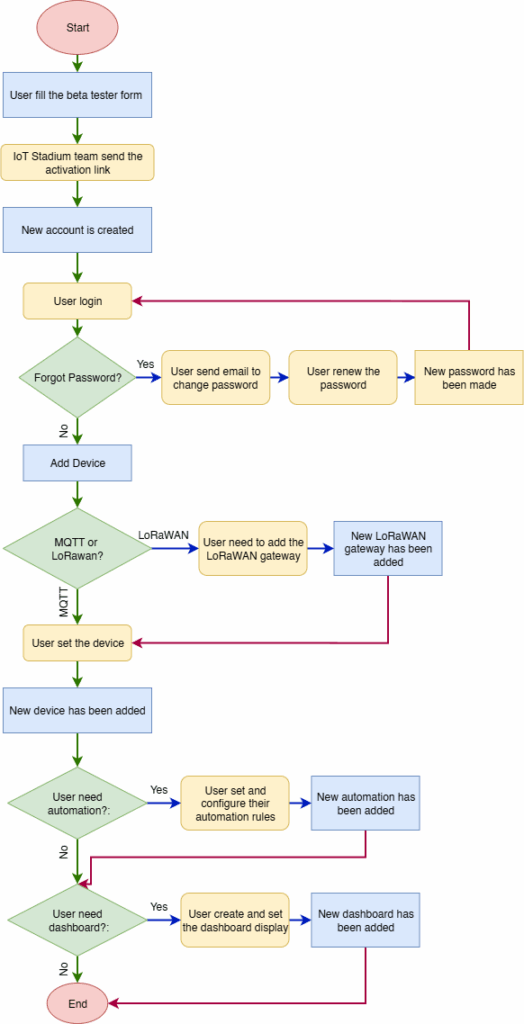
Each step will help you understand how to connect your devices, configure automation, and set your own dashboard.
Sign Up or Login
Since we are currently in the Beta Testing phase, we invite you to register as a Beta Tester. During this stage, you will be asked to review and agree to our Beta Tester Agreement, and we will request your feedback after using the platform for a specified period.
Here are the steps you need to follow:
- Register as a Beta Tester by clicking this link.
- Activate your account using the confirmation email we send you.
- Complete your account setup by setting your password and profile details.
- Once your account is ready, you can start using IoT Stadium.
Add Device
In our context, device is containing sensor and controller. We allow our user to use any device, whether its from the certain manufacturer or using your own DIY device. On this Beta Tester phase, we focus on two connectivity options: MQTT or LoRaWAN.
In this section you need to decide whether you will choose between MQTT or LoRaWAN.
MQTT
MQTT stands for Message Queuing Telemetry Transport—a lightweight, machine-to-machine network protocol based on a publish-subscribe model. It is commonly used for message queuing and real-time communication in IoT systems.
Setting up MQTT is simple. Once you choose MQTT as your connectivity type:
- Connect your IoT device to a nearby Wi-Fi network.
- Your device will send data through Wi-Fi to the cloud.
- Our platform will receive this data so you can monitor or control your device in real time.
One key benefit: you don’t need to install any additional gateway. Just make sure your IoT device has a stable Wi-Fi connection, and you’re good to go.
For further process, you can click on this article.
LoRaWAN
LoRaWAN (Long Range Wide Area Network) is a type of wireless communication that uses low-power, long-range radio frequencies to transmit data between your IoT device and our platform. Each country or region operates on a specific frequency plan. In Indonesia, the registered LoRaWAN frequency is AS923–2 (also referred to as “AS2”).
Our platform integrates with The Things Network, which is powered by The Things Stack—a LoRaWAN network server that manages and receives messages from LoRaWAN-enabled devices.
If you choose LoRaWAN:
- You’ll need to set up a LoRaWAN gateway to receive data from your device.
- The gateway must support the same frequency plan (AS923–2) as your device to ensure compatibility.
LoRaWAN is ideal for long-range, low-power applications—especially in environments where Wi-Fi coverage is limited or power consumption is a concern.
For more detailed action, you can read on this article.
Automation
Once you've added your devices, the next step is to set up automation—either to reduce manual tasks or simply to receive useful updates automatically.
In IoT Stadium, you can choose from several automation options:
- Telemetry Trigger – Automatically respond when a specific telemetry condition is met (e.g., temperature exceeds a threshold).
- Controller Trigger – Trigger an action when a control input changes or is received.
- Set BLE Gateway Trigger – Trigger events based on BLE beacon proximity or signal detection via a gateway.
- Set Snapshot – Capture and store a snapshot of telemetry or system state for reporting or review.
- Set the Schedule – Run actions based on a time schedule (e.g., daily, weekly, or custom intervals).
The setup process is straightforward:
- Choose your automation type based on your use case.
- Define the trigger or schedule, depending on the type you selected.
- Set the desired action—this could be controlling a device, recording a snapshot, or sending a notification.
- Once saved, the automation will run based on the defined conditions. If the action includes a notification, it will be sent to your registered email.
Dashboard
With IoT Stadium dashboard you will be able to monitor your data using some widgets, which visually represent data to make it easier to understand, analyze, and communicate information.
Some of the widgets we provide are:
- Charts:
- Line Chart – Displays continuous data points over time.
- Bar Chart – Compares different categories or data groups.
- Area Chart – Line chart with filled area for emphasis.
- Gauge – Real-time values against thresholds.
- Bar Gauge – Uses bars to compare metrics.
- Heat Map – Visualizes intensity/density across a space.
- Table – Rows and columns for detailed analysis.
- Card – Highlights a key metric (e.g., total devices).
- Power Circuit Breaker – Shows circuit state (on/off).
- Energy – Displays energy consumption data.
- Water – Water usage or sensor readings.
- Snapshot – Fixed view of selected data.
- Controller Widget – Control connected devices.
- Map Widget – Plots devices/assets on a real-world map.
For further information, please have a look at this page.